America’s approaching debt crisis is the topic de jour, both in the news room and in the living room. We have the fiscal cliff, the battle of the debt ceiling (parts I, II and soon to be III), the sequester, fiscal commissions, etc. We are shown scary charts, and told (truthfully) that the federal government is running another trillion dollar deficit and borrows 46 cents of every $1 it spends.
However, what we do not see is a careful examination of what is driving these deficits, and what that means for our future and our policy choices. In this, my first series of post, I will drive to do just that with simple charts from freely available data sources.
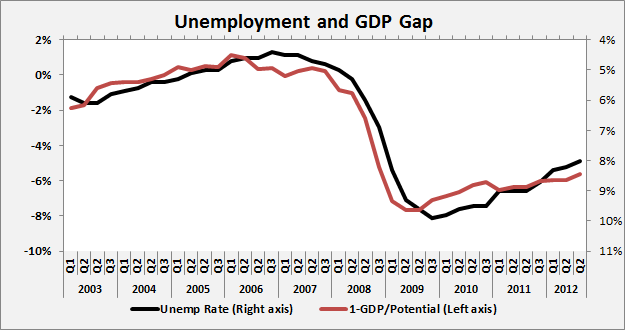
There are three things that go into the debt to GDP ratio. First, there is the GDP. A fall in GDP will drive up the ratio even if debt does not change. Second, there are the two parts to the debt: revenues, and expenditures. While the economy goes through booms and bust, over the long haul GDP tends to grow at a pretty steady rate. Economist and statistician have a handy, standardized way of removing cyclical components from GDP. It is called potential GDP. A simple view of it is just to say it is what would GDP be if everyone was employed. As you can see below, it correlates pretty closely with the inverse of the unemployment rate:
For reference, here is the long term view of GDP gap, which is just 1 – Potential GDP / GDP:
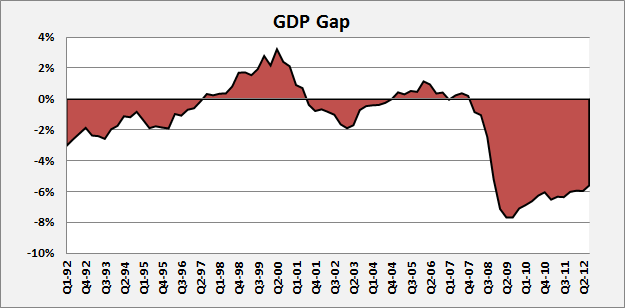
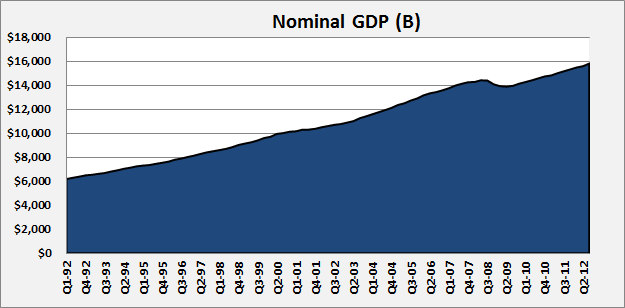
It is clear that something happened in the fall 2007. Something very bad! We will return to that. Here is another view that again, shows that something bad happened to GDP in 2007, and we have not recovered:
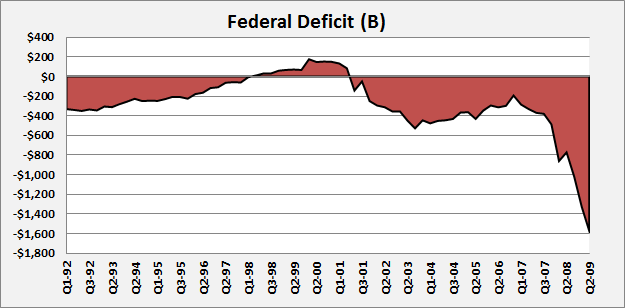
It is only with the background of what was happening in the economy that we can start to look at the deficit. Here are two simple charts of federal government expenditures and revenue:
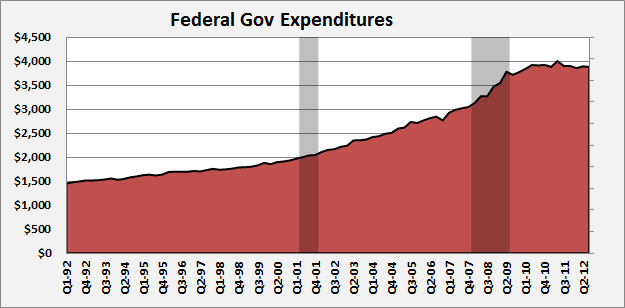
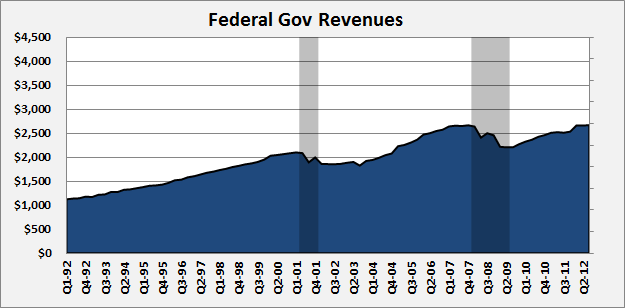
We see a small spike in expenditures during the recession, but they then go flat. The revenue side is more dynamic. Federal government revenues drop precipitously (17.4% from peak to trough). In fact, in purely nominal terms (not adjusting for inflation or population) they did not pass the pre-recession peak set in Q2 2005 until Q1 2012 – nearly 5 years!
From 1992-2007 government revenues grow about 1.38% per quarter and expenditures grew at 1.18%. If numbers held over the six quarters of the recession we would expect expenditures to grow by 7.3% and revenue to grow by 8.5%. Instead revenue fell by 16.4% (25% below the pre-recession trend!), and expenditures grew by 18.9% (11.6% off of trend).
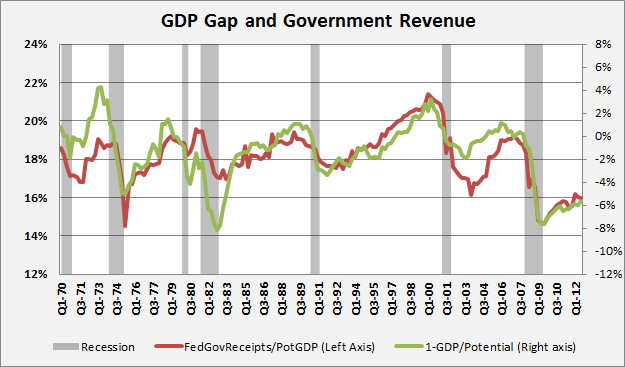
The point of these charts and data points is to demonstrate that the budget deficit is mainly driven by the very severe recession, from which we still have not fully recovered. But one final chart to drive home this point. Revenues actually vary pretty consistently with drops in unemployment, and along with that potential GDP. When controlling for the GDP gap, the deficit we are facing is not an outlier . What is abnormal is the size, and duration of this drop in employment and GDP. This is what we should be discussing! (And, in future post, hopefully I will).
APPENDIX: Data Sources
All the data was obtained using Federal Reserve Bank of St. Louis’s excellent excel plug-in: http://research.stlouisfed.org/fred-addin/install_windows.html. Here are the exact series and calculations for each chart. In parentheses are the FRED series IDs. Corrections and concerns appreciated!
1: Federal Deficit. This is simply [Federal government total expenditures] (W019RCQ027SBEA) – [Federal Government Current Receipts] (FGRECPT). Both come from the U.S. Department of Commerce: Bureau of Economic Analysis
2a: Unemployment. [Civilian Unemployment Rate] (unrate) From the U.S. Department of Labor: Bureau of Labor Statistics
2b: GDP Gap. 1 – ( [Nominal Gross Domestic Product] (GDP) ) / ( [Nominal Potential Gross Domestic Product] (NGDPPOT) ). Both from the U.S. Department of Commerce: Bureau of Economic Analysis.
3: GDP Gap. 1 – ( [Nominal Gross Domestic Product] (GDP) ) / ( [Nominal Potential Gross Domestic Product] (NGDPPOT) ). Both from the U.S. Department of Commerce: Bureau of Economic Analysis.
4: Nominal GDP. [Nominal Gross Domestic Product] (GDP). From the U.S. Department of Commerce: Bureau of Economic Analysis.
5: Federal Government Expenditures.[Federal government total expenditures] (W019RCQ027SBEA) From the U.S. Department of Commerce: Bureau of Economic Analysis
6: Federal Government Revenues. [Federal Government Current Receipts] (FGRECPT). From the U.S. Department of Commerce: Bureau of Economic Analysis
7a: Government Revenues / Potential GDP. ( [Federal Government Current Receipts] (FGRECPT) ) / ( [Nominal Potential Gross Domestic Product] (NGDPPOT) ). Both from the U.S. Department of Commerce: Bureau of Economic Analysis
7b: GDP Gap. 1 – ( [Nominal Gross Domestic Product] (GDP) ) / ( [Nominal Potential Gross Domestic Product] (NGDPPOT) ). Both from the U.S. Department of Commerce: Bureau of Economic Analysis.