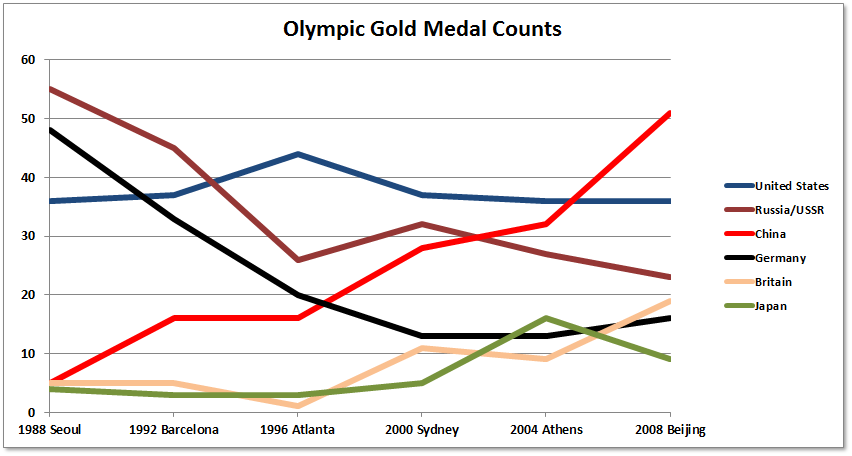
I put this chart together because after reading this BBC article I was interested in seeing the visual. Apart from the well known and discussed rise in China, and the fall in both Russia and Germany, what strikes me is the truly remark consistency of the US gold medal count. Aside from the 1996 Atlanta Olympics (with the home field advantage boost), since 1988 the US has received either 36 or 37 medals. Going back further, in 76 and 72 Team US had 34 and 33 medals respectively (I skipped 1984 and 1980 due to the boycotts).
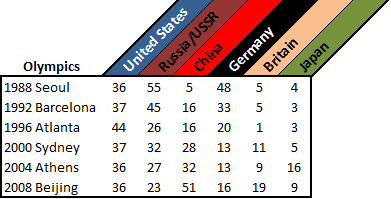
And here are the actual numbers:
Notes: Germany includes both East and West. Russia includes the unified team for 1992.
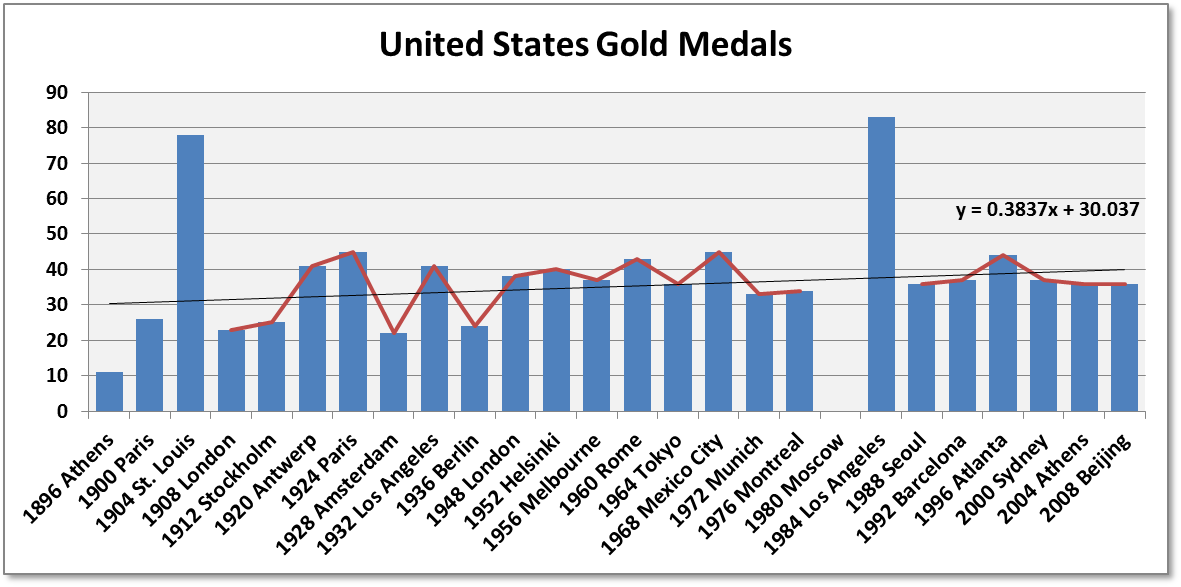
UPDATE: I took a look at the full historical medal counts for the US. This consistency is not new! While there are obvious outliers – 1896 first olympics, 1904 the US was the only team in half the events, 1980/1984 boycotts (which I excluded in the trend) – it is extraordinary how much in the world has changed over the 112 years, yet Team USA pulls in about 36 golds in the summer games. Also, the outliers balance themselves out: average including them 36.58, average excluding them 35.41.


