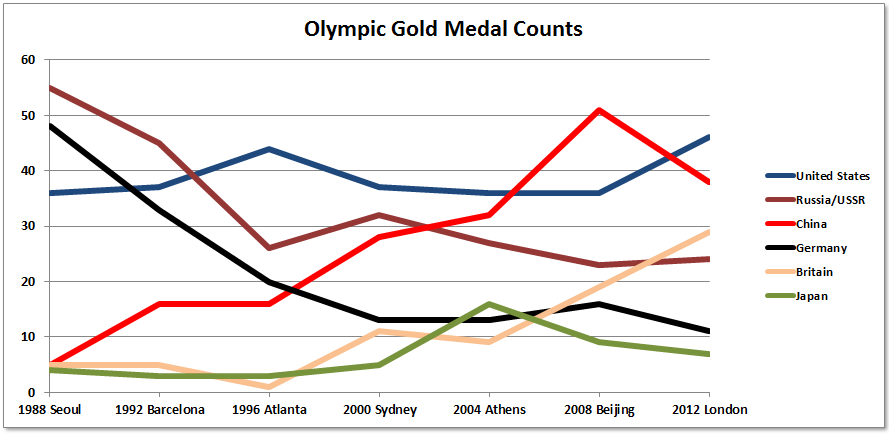
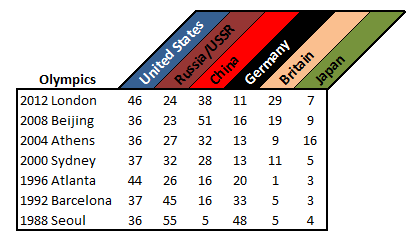
I’ve updated the charts below to include the results from the just completely London 2012 games.
This was a very good Olympics for the USA. Ignoring the boycotted games of 1984, and the barely attended games of 1904, this was the most Olympic gold metals the United States had ever brought home. This is significant achievement in an era where the global economy is (happily) starting to catch up. In 1999, the US hit a post-1970 peak of 28.4% of world GDP and by 2011 this had fallen steadily to a post-1970 low of 25.5% (post 1970 because the easiest data source, USDA, only went back that far). FYI, those 46 gold medals only represent 15% of the total 302 gold medals awarded, so maybe we’re punching below our weight in terms of GDP.
While much has been made of the achievements of the British team (which I do not want to diminish), their leap from 2004 to 2008 was actually more significant. Team GB went from 9 gold medals in Athens to 19 in Beijing – more than double. They added another 10 this year, for 19 total, but that was just over a 50% increase – substantial, but not as dramatic as four years ago.
After a lot of early disappointment, Russia actually improved their gold medal haul over Beijing. After a slight improvement in Beijing, Germany hit a new post-boycott low.
China dropped off significantly from when they hosted, showing more evidence of a home-field advantage effect. NPR had an interesting piece discussing how this effect comes into play (thanks to my brother-in-law for pointing me to that). Ignoring last year’s bump, China’s trend line shows a pretty steady climb. This sets up a pretty good battle for supremacy in Rio four years from now. However, regardless of who is expected to win, I think we all will be rooting for NBC to broadcast the games live this time!

