The DocGraph / CareSet team does great work and I have personally benefited from the availability of their original CMS teaming data, even using it in a chapter from my dissertation.
They recently updated their methodology and created a new group of datasets they call “root NPI“. Along with this update, they will no longer be updating the original format teaming data. While I understand the need for this change, the fact that they have neither updated the original data, nor retroactively created the new RootNPI data (beyond 2014) is a problem for me as I use the time variation in these datasets and would like to be able to add years.
To get around this limitation I created a method, to a fairly close approximation, creates the new data sets from the old, and therefore allows me to perform analysis on data from 2009 to 2015. The idea is to take the 180 day files and make them symmetrical. My commented SAS code is here, but the main commands are:
/* Duplicate the teaming data, switching NPI_Number1 and NPI_Number2 */

DATA phy_ref_2014_180_x2;

SET ref_med.phy_ref_2014_180(rename=(NPI_Number2=NPI_A NPI_Number1=NPI_B))

   ref_med.phy_ref_2014_180(rename=(NPI_Number1=NPI_A NPI_Number2=NPI_B));

run;

/* Choose the NPI pair with the most patients */

proc sql;

CREATE TABLE npiroot_2014_180

as

SELECT NPI_A, NPI_B

   , MAX(Bene_Count) as patient_count

FROM phy_ref_2014_180_x2

GROUP BY NPI_A, NPI_B

; quit;
Complete data exist from both data sets for 2014, which allows me to compare the effectiveness of my transformation method. Here are some statistics from the comparison:
- For the pairs that match, there is a very high correlation between the two (0.97938, see scatter below)
- While 37.5% of the pairs do not match (50m of 185m), these pairs only account for ~10% of the total number of shared patient connections (~800m of ~7.5B)
- It looks like most of the missing connections happen right near the 11 cutoff.
- In fact, for 30% of missing pairs the present pair has a patient count of 11
- It is 19% for 12, 13% for 13, 9% for 14
- 90% have fewer than 22, 95% <33, and more than 99% fewer than 100
- There seems to be a decently large, non-random set of providers that are in the new data, but not in the old. They all seem to be medical device related. Here are the top 10: Arriva Medical, Degc Enterprises, Lincare, All American Medical Supplies, United States Medical Supply, Med-Care Diabetic & Medical Supplies, Ocean Home Health Supply, Binson’s Hospital Supplies, Passaic Healthcare Services, DJO
- There is not a similar pattern for providers in the old data, but not in the new. For consistency across years, I will probably exclude the above set of providers from my analyses.
- Here is a comparison of the two datasets in terms of number of patients (the strength of the connection (RootNPI vs Constructed)
- Median: 21 and 21
- Mean: 41.6 vs 43.4
- 95 percentile: 128 vs 134
- 99 percentile: 347 vs 378
- Standard Deviation: 104.5 vs 116.6
- It may seem odd that the constructed data set has a larger average than the new, Root NPI data, since the new one is using the full year to define a connection, while the old data set used the 180 day window. I think what accounts for the discrepency is the fact that the old data set included connections that happen 6 months after Dec 2014, which the RootNPI omits.
Finally, to ensure that there is not any odd systematic variations between the two measure, I created a scatter plot comparing the patient count I calculated from the original teaming data with the new RootNPI patient count. I truncated the plot at 1000, both because there are just too many obs <1000 and because I am mainly interested in what happens to the relationship as both get large.
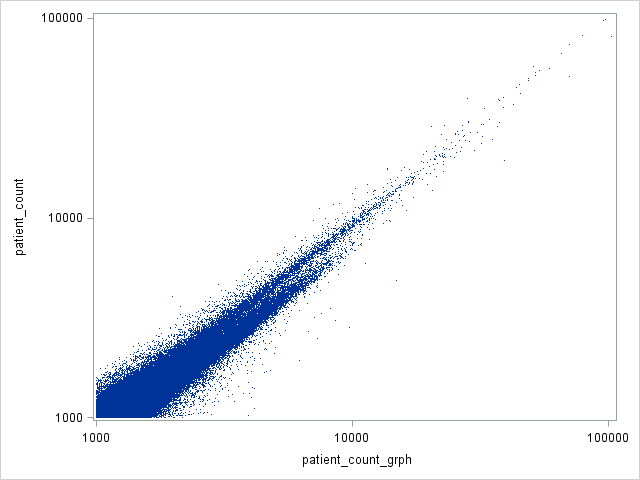
To me, this looks really reassuring. The two measures seem to be similar, with some noise, and this noise appears to get smaller as the number of patients gets larger.