My Summer Olympics post two years ago was fairly popular, so now that I have a brief respite from graduate school deadlines I put together a couple of charts showing the Winter Olympic Medals over time.
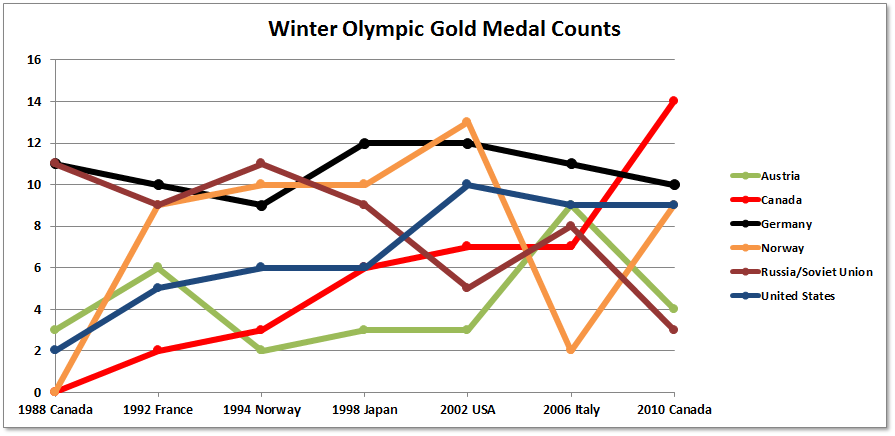
There are significantly fewer events, and thus medals in the Winter Olympics – currently 302 to 98. That makes the Gold medal counts a bit more noisy (small sample size), so I’m also including a chart total medal counts (unweighted).
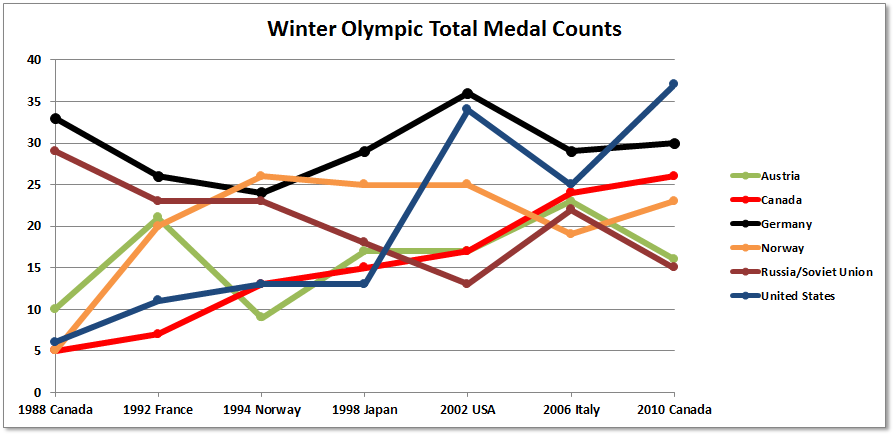
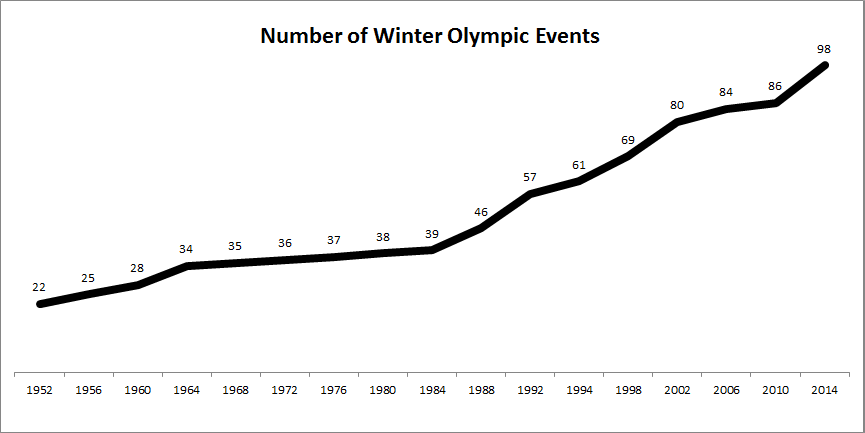
Both charts show Canada and the United States rising. One thing that these charts are missing is the fact that the total number of events has been climbing significantly as well – from 46 in 1988 to 86 in 2010 and this year’s games features 98 events.
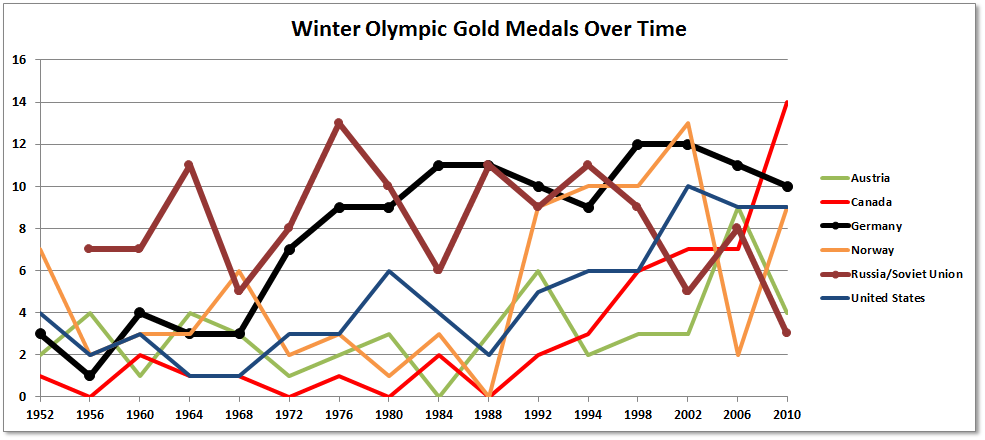
Another fact that is not captured by the narrow window of years featured above is how dominant Germany and the Soviet Union were beginning in the early 1970s. From 1972 to 1998 they combined took home 40.5% of the gold medals. The last time the United States led the gold medal counts for the Winter Olympics was 1952 – which makes the lead of this story (The United States has a case of Olympics medal envy) seem a bit odd and ill-informed. The 2010 Winter games was the first time that the United States had led the total medal count since 1932 – a games which were hosted by the United States and only featured 10 other countries. Even then, we only beat out Norway by 2 medals.
So congratulations to Canada on becoming a Winter Olympics power house – because let’s be honest, you don’t have all that much else going for you. But that success and growth has been alongside the United States and not at her expense.